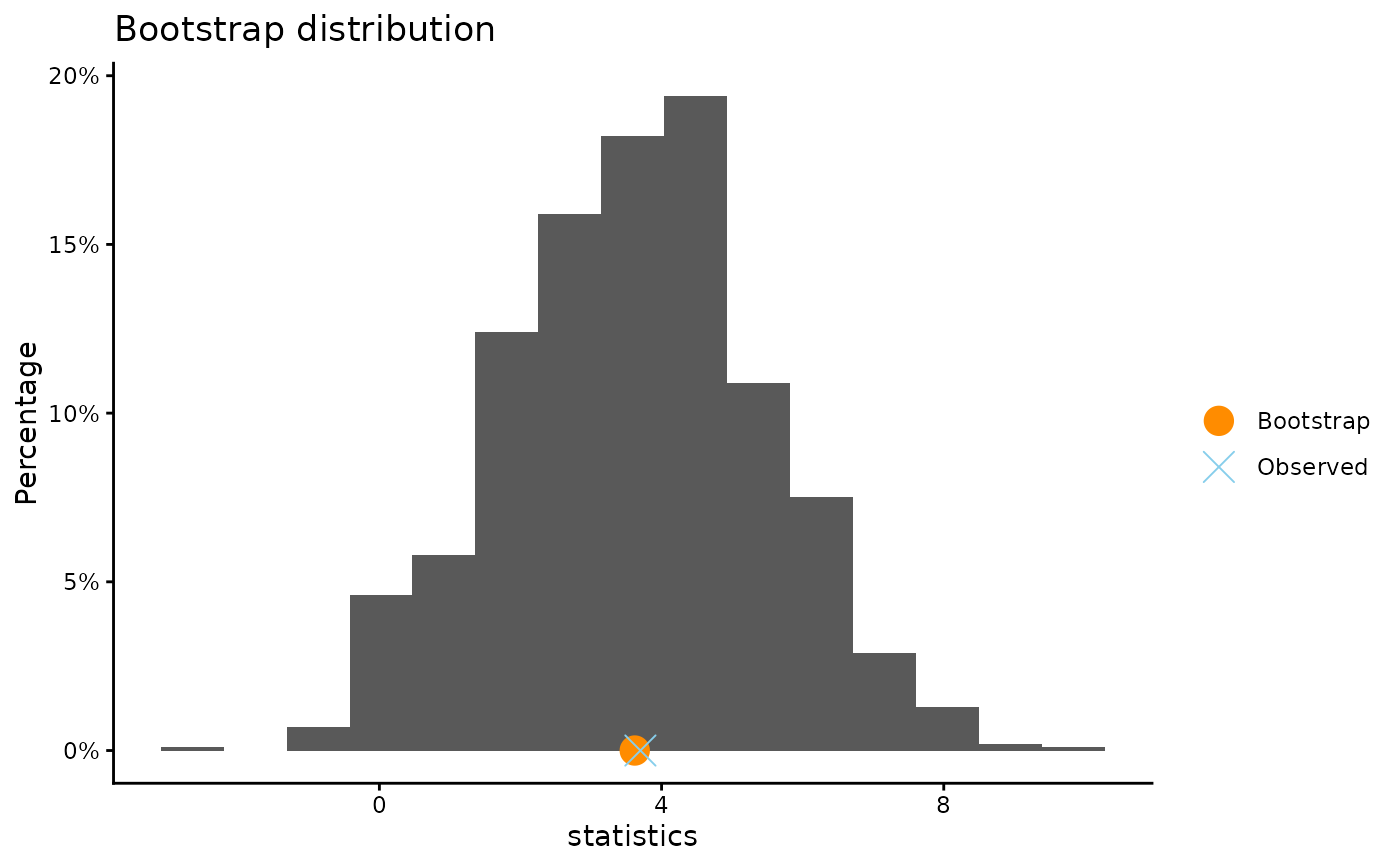
Plot the bootstrap distribution returned as a carlboot object.
Usage
# S3 method for class 'carlboot'
plot(x, bins = 15, size = 5, xlab = NULL, ylab = NULL, title = NULL, ...)

# S3 method for class 'carlperm'
plot(x, bins = 15, size = 5, xlab = NULL, ylab = NULL, title = NULL, ...)
Arguments
- x
The carlboot object to print.
- bins
number of bins in histogram.
- size
size of points.
- xlab
an optional character string for the x-axis label
- ylab
an optional character string for the y-axis label
- title
an optional character string giving the plot title
- ...
not used
Examples
boot_dist <- boot(ToothGrowth$len, ToothGrowth$supp, B = 1000)
plot(boot_dist)
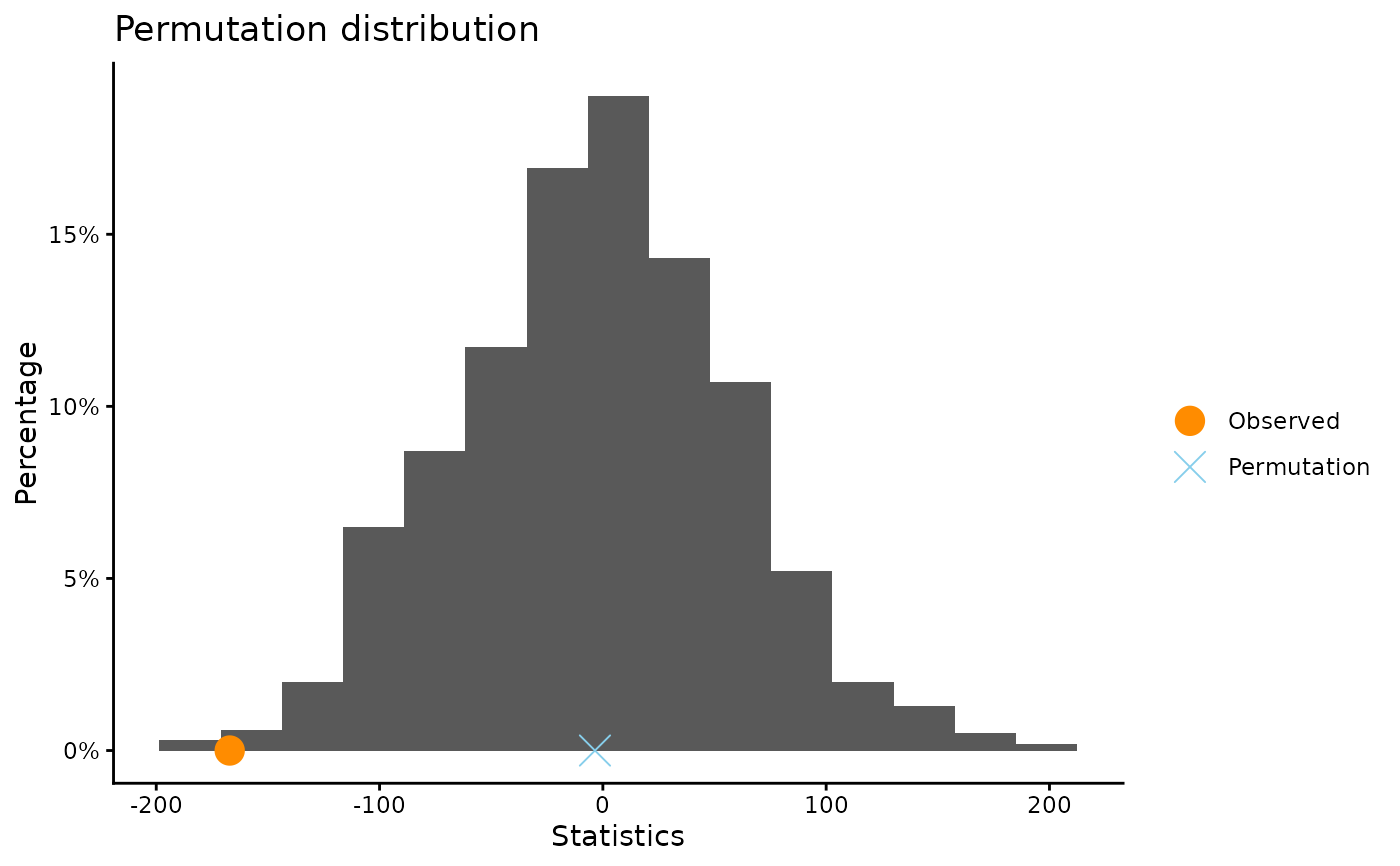
 perm_dist <- permTest(states03$ViolentCrime, states03$DeathPenalty, B = 999)
plot(perm_dist)