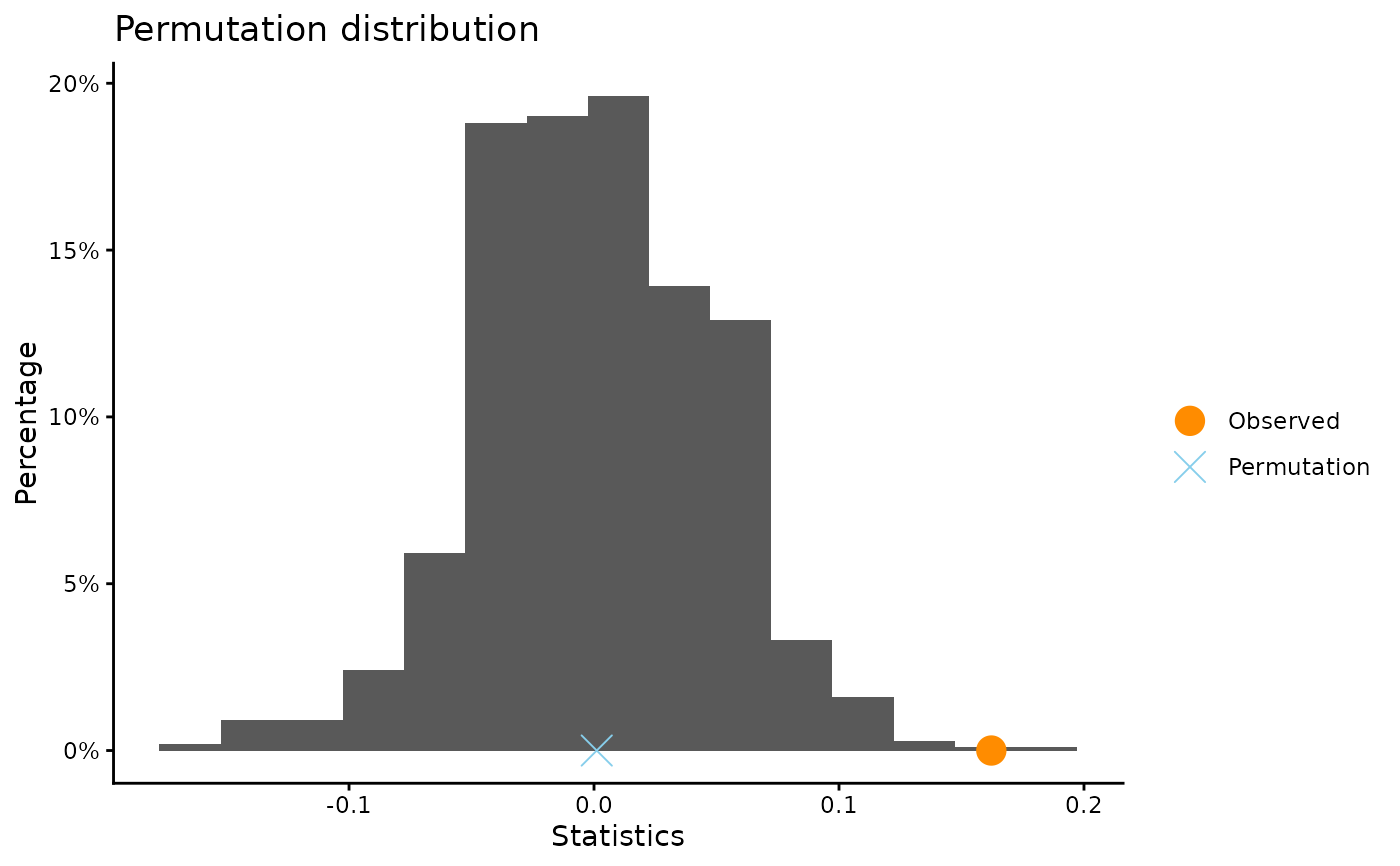
Permutation test to test a hypothesis involving two samples.
Usage
permTest(x, ...)

# Default S3 method
permTest(
  x,
  group,
  statistic = mean,
  success = NULL,
  B = 9999,
  alternative = "two.sided",
  plot.hist = TRUE,
  plot.qq = FALSE,
  xlab = NULL,
  ylab = NULL,
  title = NULL,
  seed = NULL,
  ...
)

# S3 method for class 'formula'
permTest(formula, data = parent.frame(), subset, ...)
Arguments
- x
a numeric, logical, factor, or character vector. Logical, factor, and character vectors with exactly two unique values are converted to 0/1, and
meanis used to compute the proportion.- ...
further arguments to be passed to or from methods.
- group
a factor variable with two levels. If
groupis a binary numeric vector, it will be coerced into a factor variable.- statistic
the statistic of interest.
- success
a character string naming the level of
xto code as 1 whenxis a logical, factor, or character variable. Defaults toNULL, which uses the second factor level (alphabetically) orTRUEfor logical vectors.- B
the number of resamples (positive integer greater than 2).
- alternative
the alternative hypothesis. Options are
"two.sided","less"or"greater".- plot.hist
a logical value. If
TRUE, the permutation distribution of the statistic is plotted.- plot.qq
a logical value. If
TRUE, then a normal quantile-quantile plot of the resampled test statistic is created.- xlab
an optional character string for the x-axis label
- ylab
an optional character string for the y-axis label
- title
an optional character string giving the plot title
- seed
optional argument to
set.seed- formula
a formula of the form
y ~ groupwhereyis numeric andgroupis a factor variable.- data
a data frame with the variables in the formula.
- subset
an optional expression specifying which observations to keep.
Details
Permutation test to see if a population parameter is the same for two populations. For instance, test \(latex\) where \(latex\) denotes the population mean. The values of the numeric variable are randomly assigned to the two groups and the difference of the statistic for each group is calculated. The command will print the mean and standard error of the distribution of the test statistic as well as a P-value.
Observations with missing values are removed.
References
Tim Hesteberg's website: https://www.timhesterberg.net/bootstrap-and-resampling
Examples
# Testing the difference in means
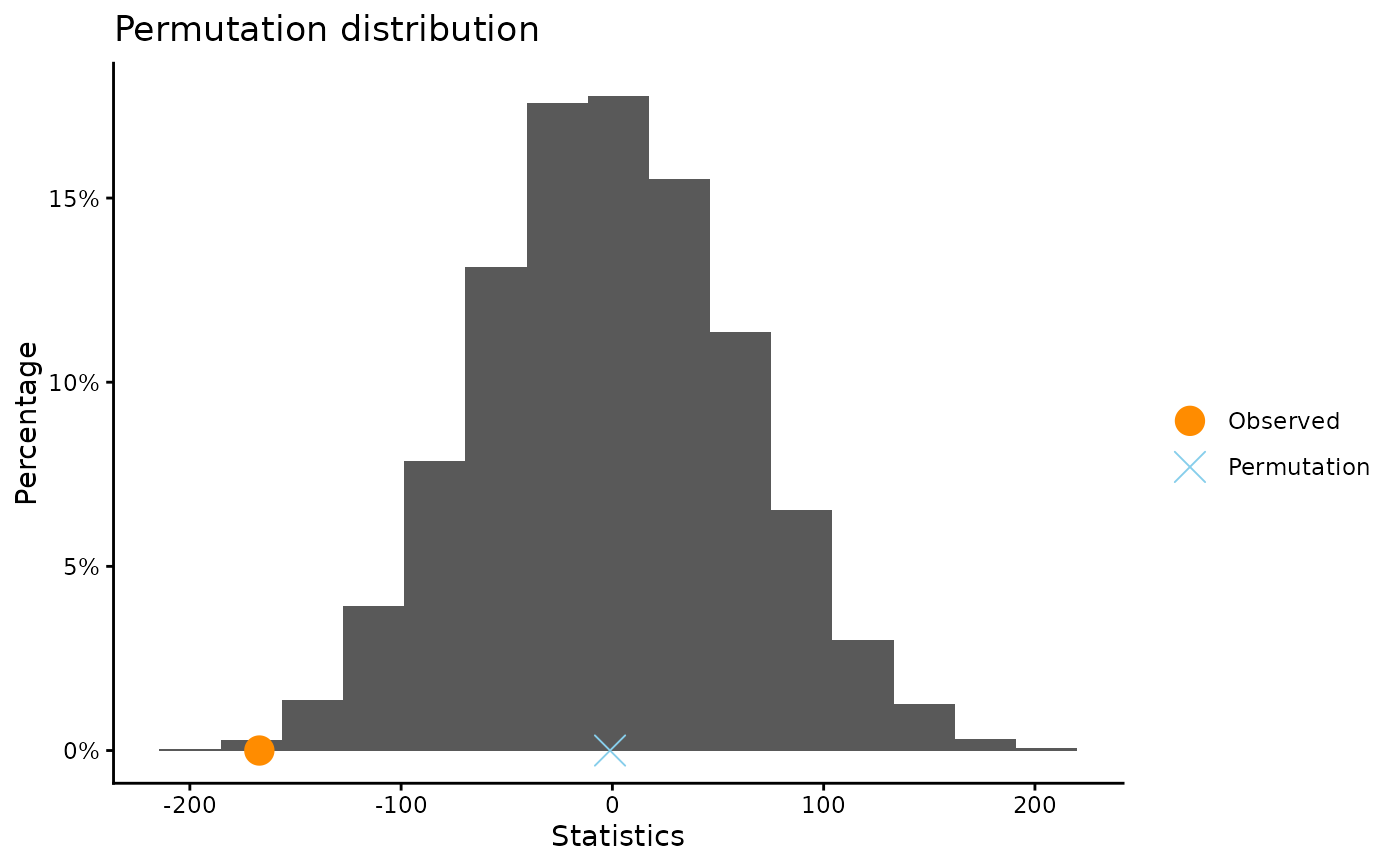
permTest(states03$ViolentCrime, states03$DeathPenalty)
#>
#> ** Permutation test **
#>
#> Permutation test with alternative: two.sided
#> Observed mean
#> No : 286.6917 Yes : 453.7974
#> Observed difference: -167.1057
#>
#> Mean of permutation distribution: -1.11434
#> Standard error of permutation distribution: 61.82947
#> P-value: 0.005
#>
#> *-------------*
#>
 #using formula syntax
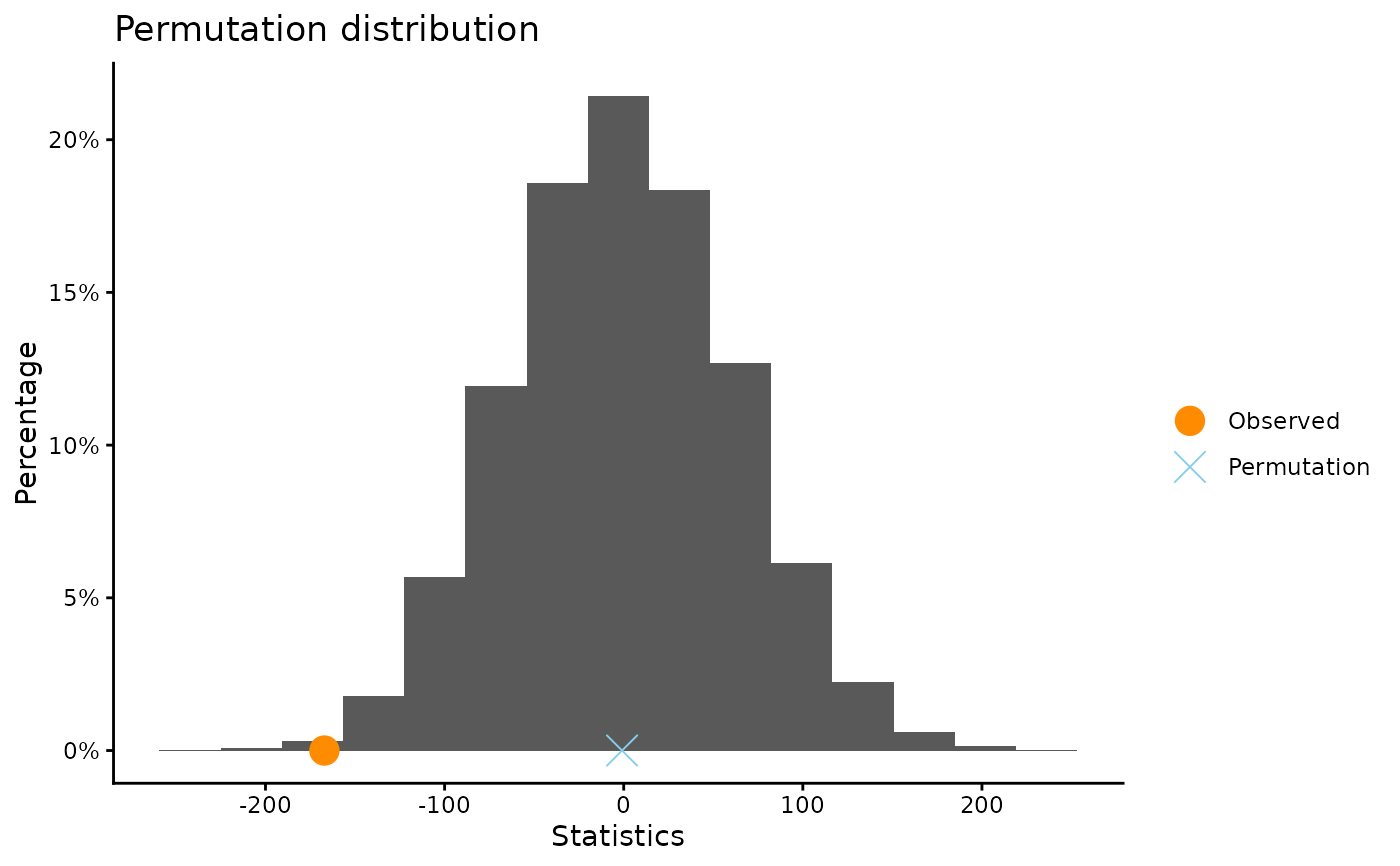
permTest(ViolentCrime ~ DeathPenalty, data = states03, alt = "less")
#>
#> ** Permutation test **
#>
#> Permutation test with alternative: less
#> Observed mean
#> No : 286.6917 Yes : 453.7974
#> Observed difference: -167.1057
#>
#> Mean of permutation distribution: -0.9316
#> Standard error of permutation distribution: 61.95138
#> P-value: 0.0023
#>
#> *-------------*
#>
 # Testing the difference in proportions
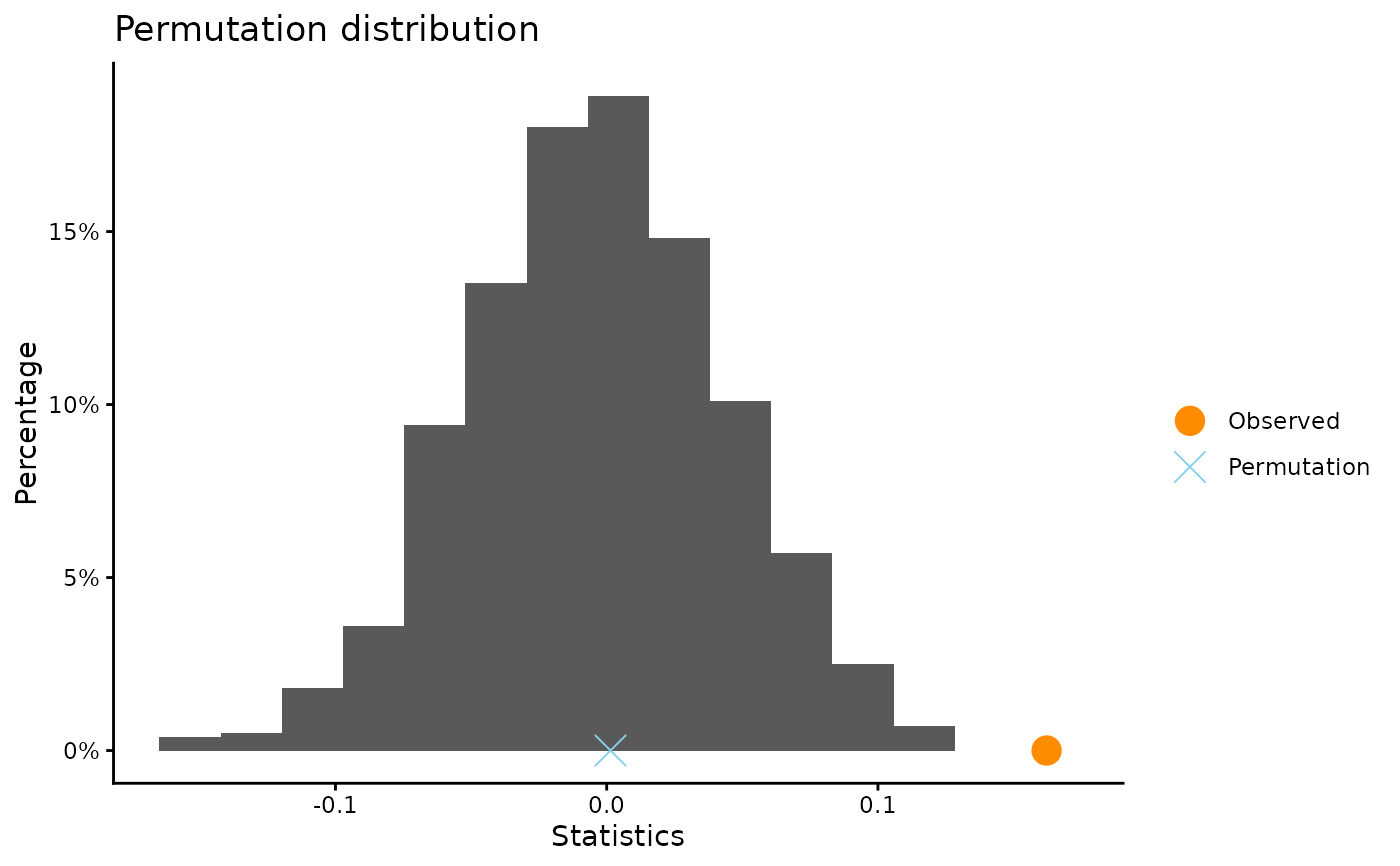
permTest(penguin_survival$Status, penguin_survival$TagType, B = 999)
#> Note: "Survived" coded as the success (1).
#>
#> ** Permutation test **
#>
#> Permutation test with alternative: two.sided
#> Observed proportion
#> Electronic : 0.3597884 Metal : 0.1976048
#> Observed difference: 0.16218
#>
#> Mean of permutation distribution: 0.00141
#> Standard error of permutation distribution: 0.04742
#> P-value: 0.001
#>
#> *-------------*
#>
 #using formula syntax
permTest(Status ~ TagType, data = penguin_survival, B = 999)
#> Note: "Survived" coded as the success (1).
#>
#> ** Permutation test **
#>
#> Permutation test with alternative: two.sided
#> Observed proportion
#> Electronic : 0.3597884 Metal : 0.1976048
#> Observed difference: 0.16218
#>
#> Mean of permutation distribution: 0.00112
#> Standard error of permutation distribution: 0.04798
#> P-value: 0.003
#>
#> *-------------*
#>