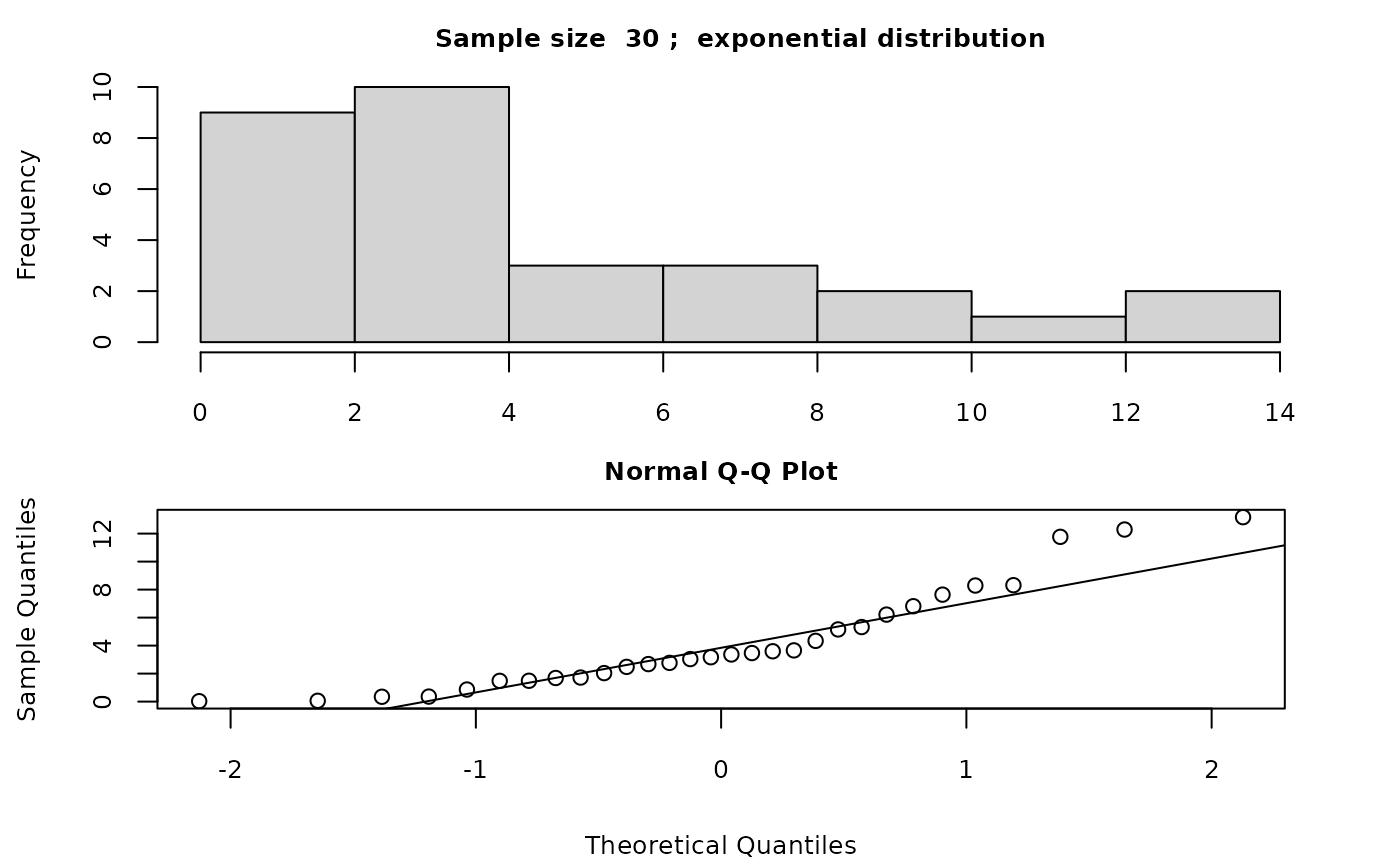
Demonstrate the normal quantile-quantile plot for samples drawn from different populations.
Usage
qqPlotDemo(
  n = 25,
  distribution = "normal",
  mu = 0,
  sigma = 1,
  df = 10,
  lambda = 10,
  numdf = 10,
  dendf = 16,
  shape1 = 40,
  shape2 = 5
)
Arguments
- n
sample size
- distribution
population distribution. Options are
"normal","t","exponential","chi.square","F"or"beta"(partial matches are accepted).- mu
mean for the normal distribution.
- sigma
(positive) standard deviation for the normal distribution.
- df
(positive) degrees of freedom for the t-distribution.
- lambda
positive rate for the exponential distribution.
- numdf
(positive) numerator degrees of freedom for the chi-square distribution.
- dendf
(positive) denominator degrees of freedom for the chi-square distribution.
- shape1
positive parameter for the beta distribution (shape1 = a).
- shape2
positive parameter for the beta distribution (shape2 = b).